Using ExcessILI with ILINet
Dan Weinberger
3/25/2020
ILINet.rmdOverview
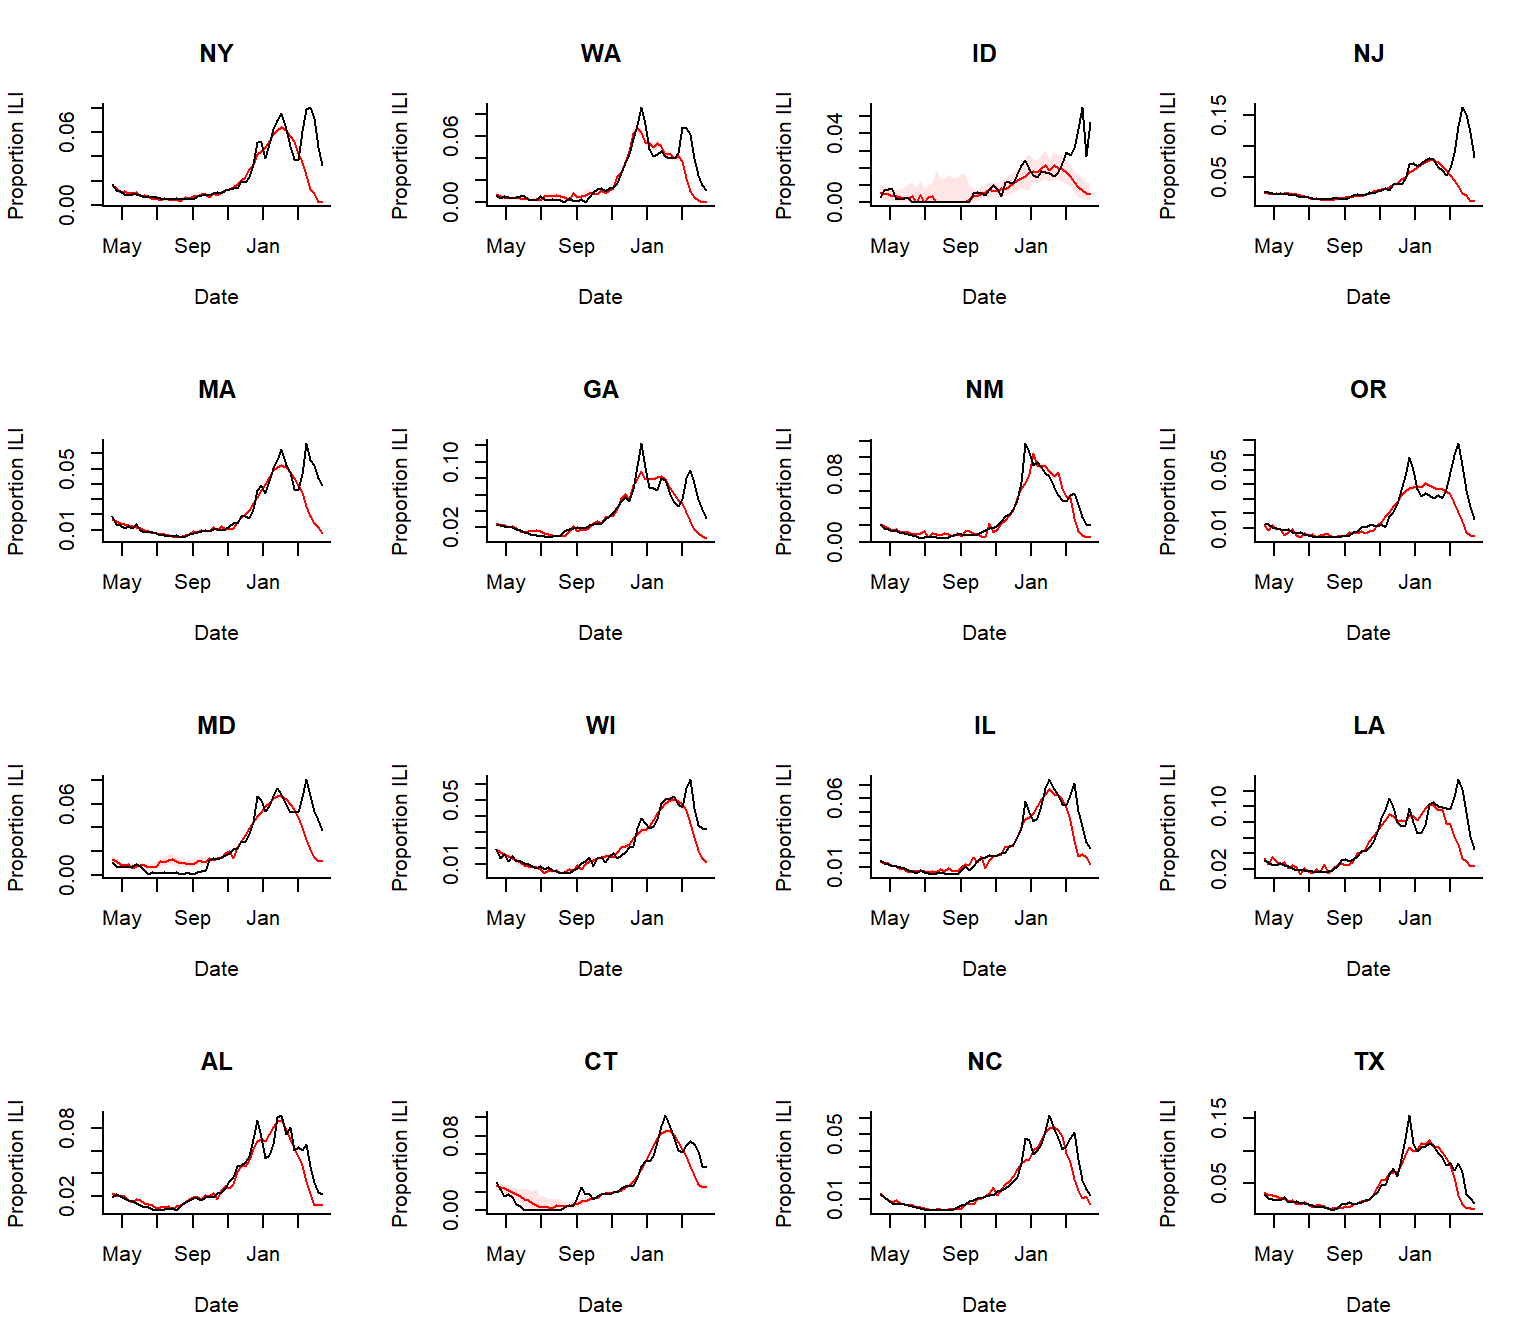
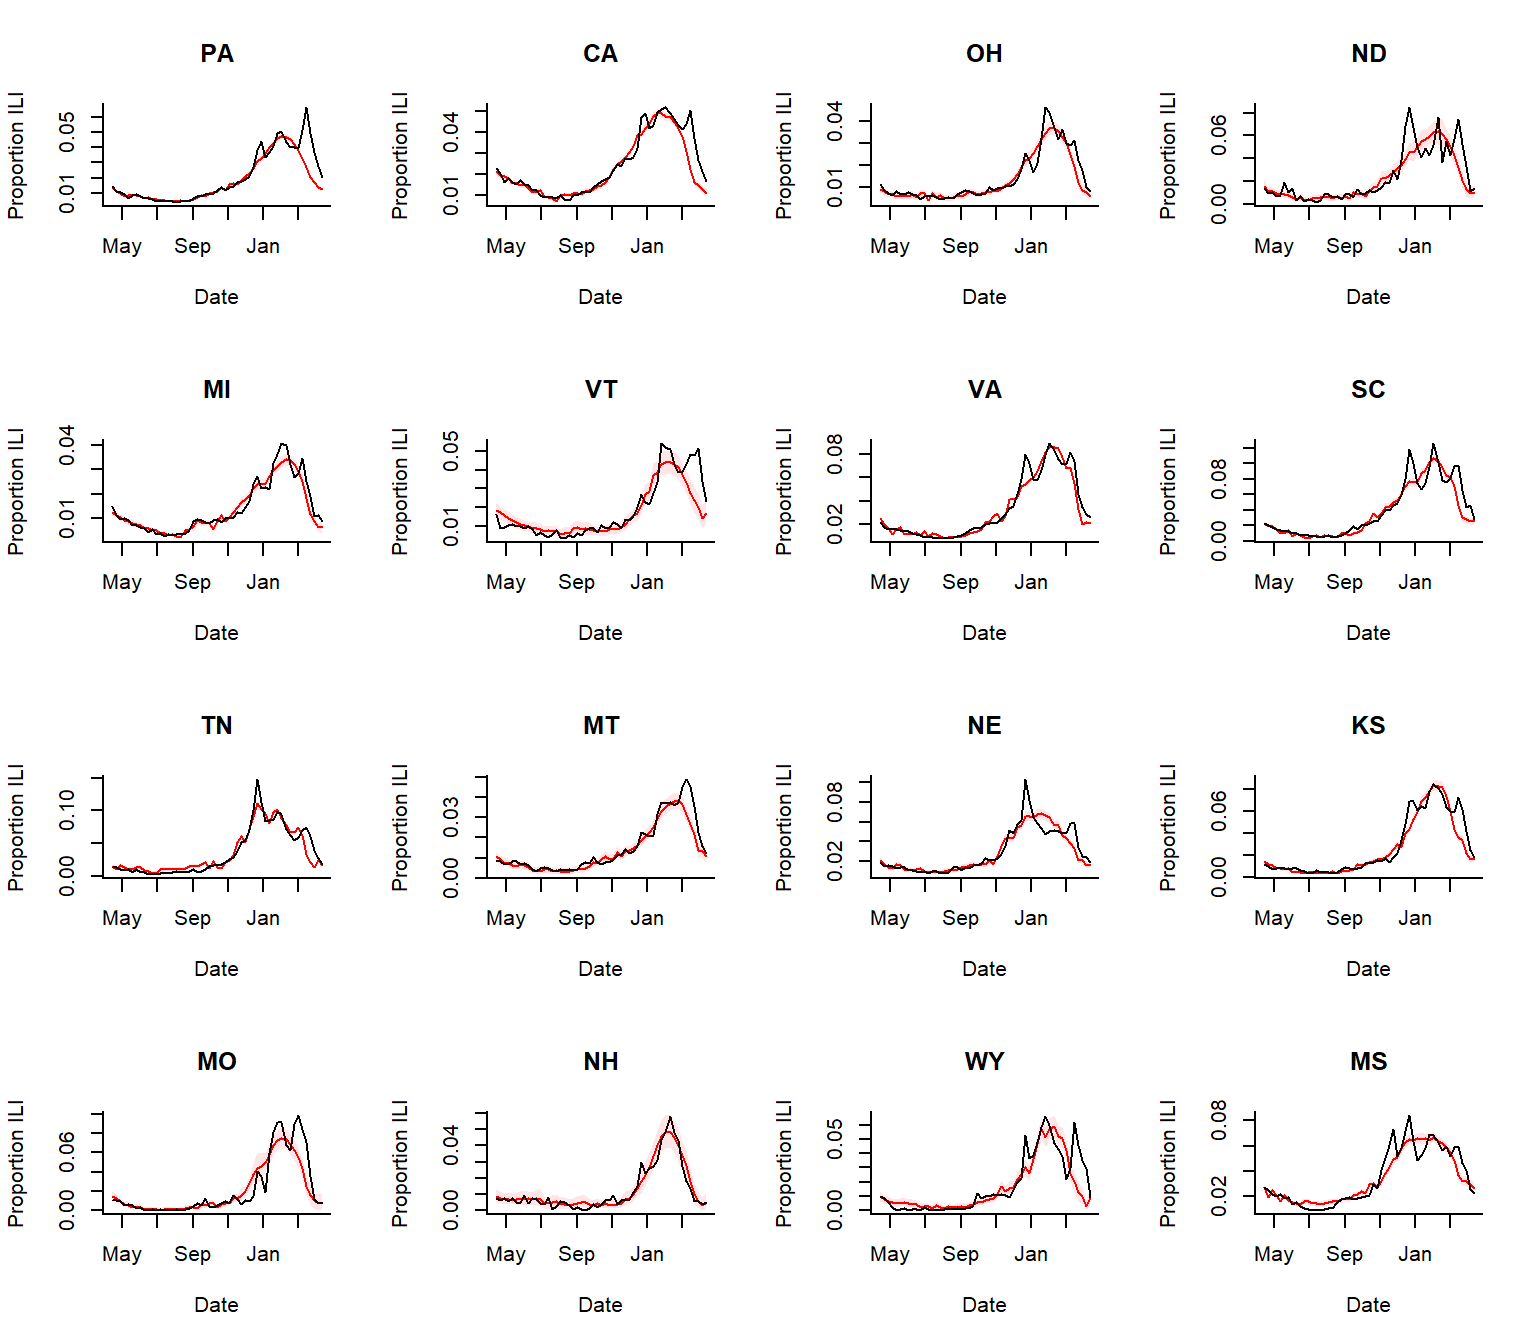
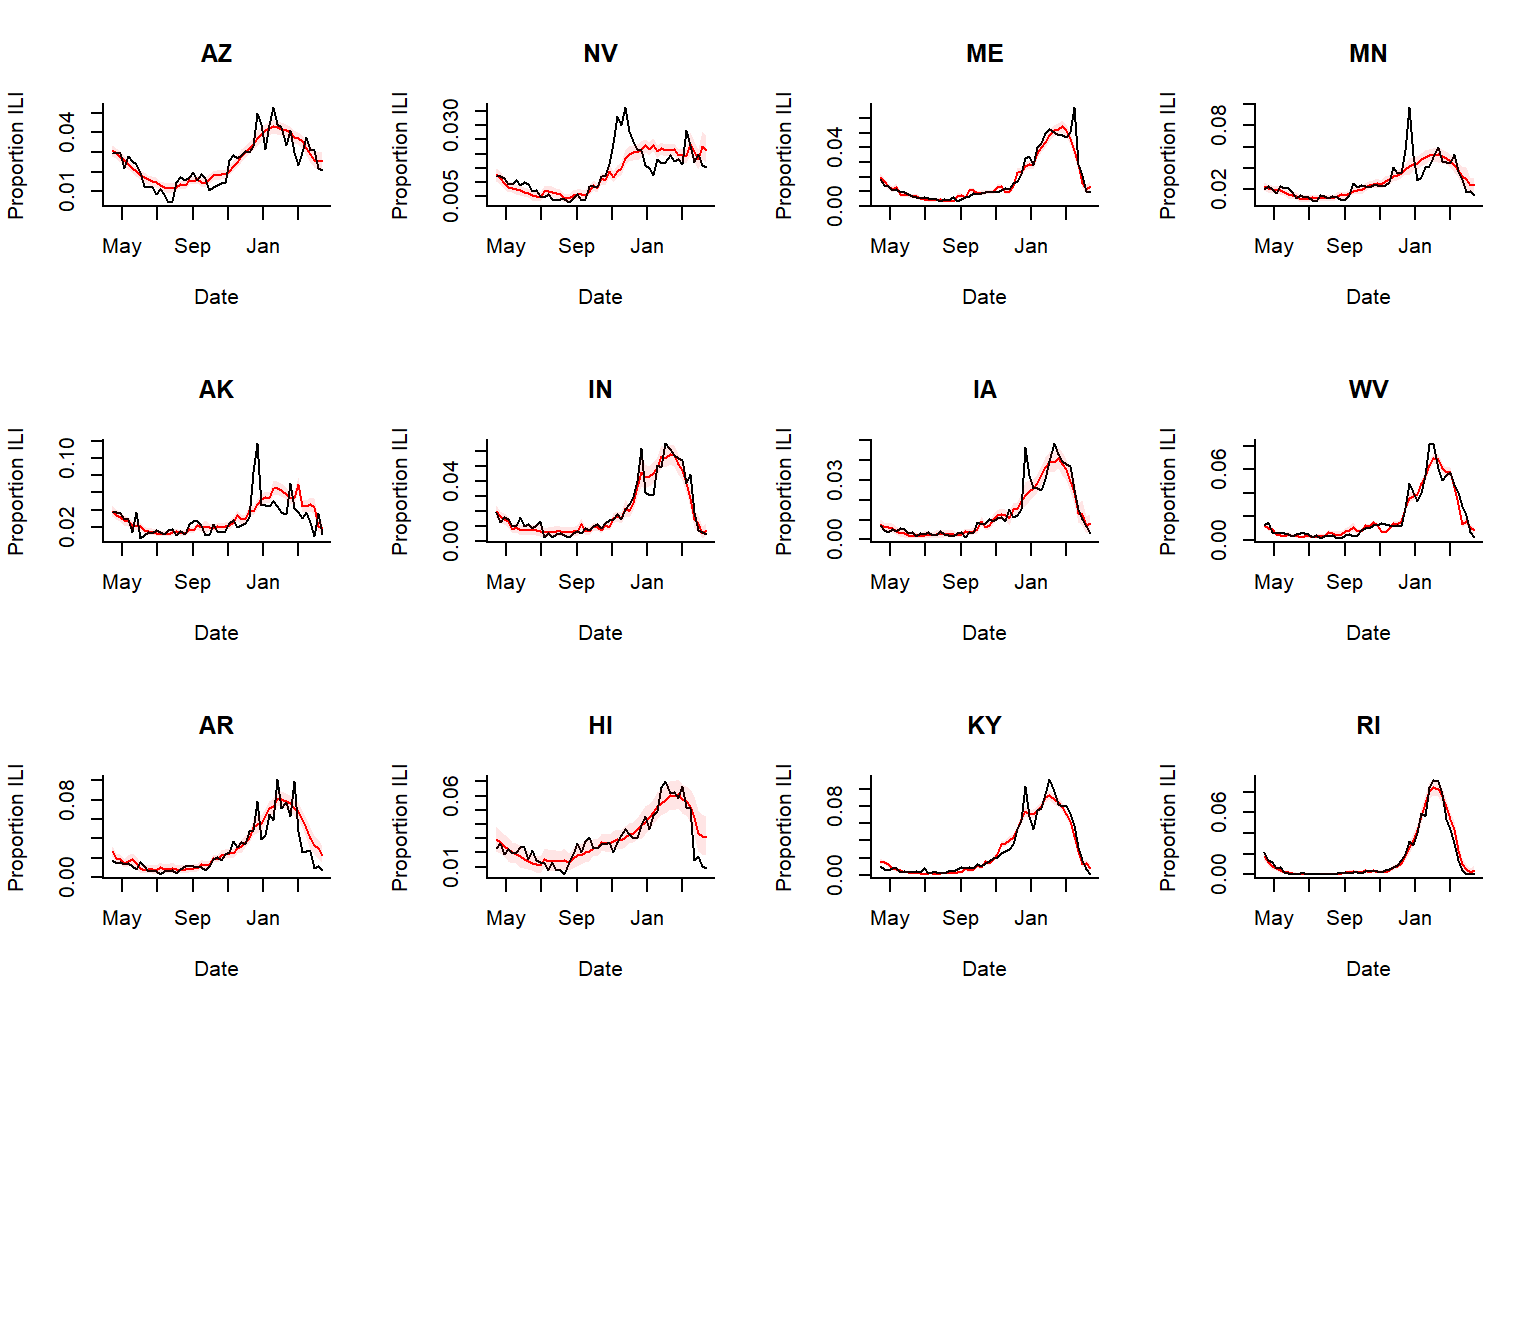
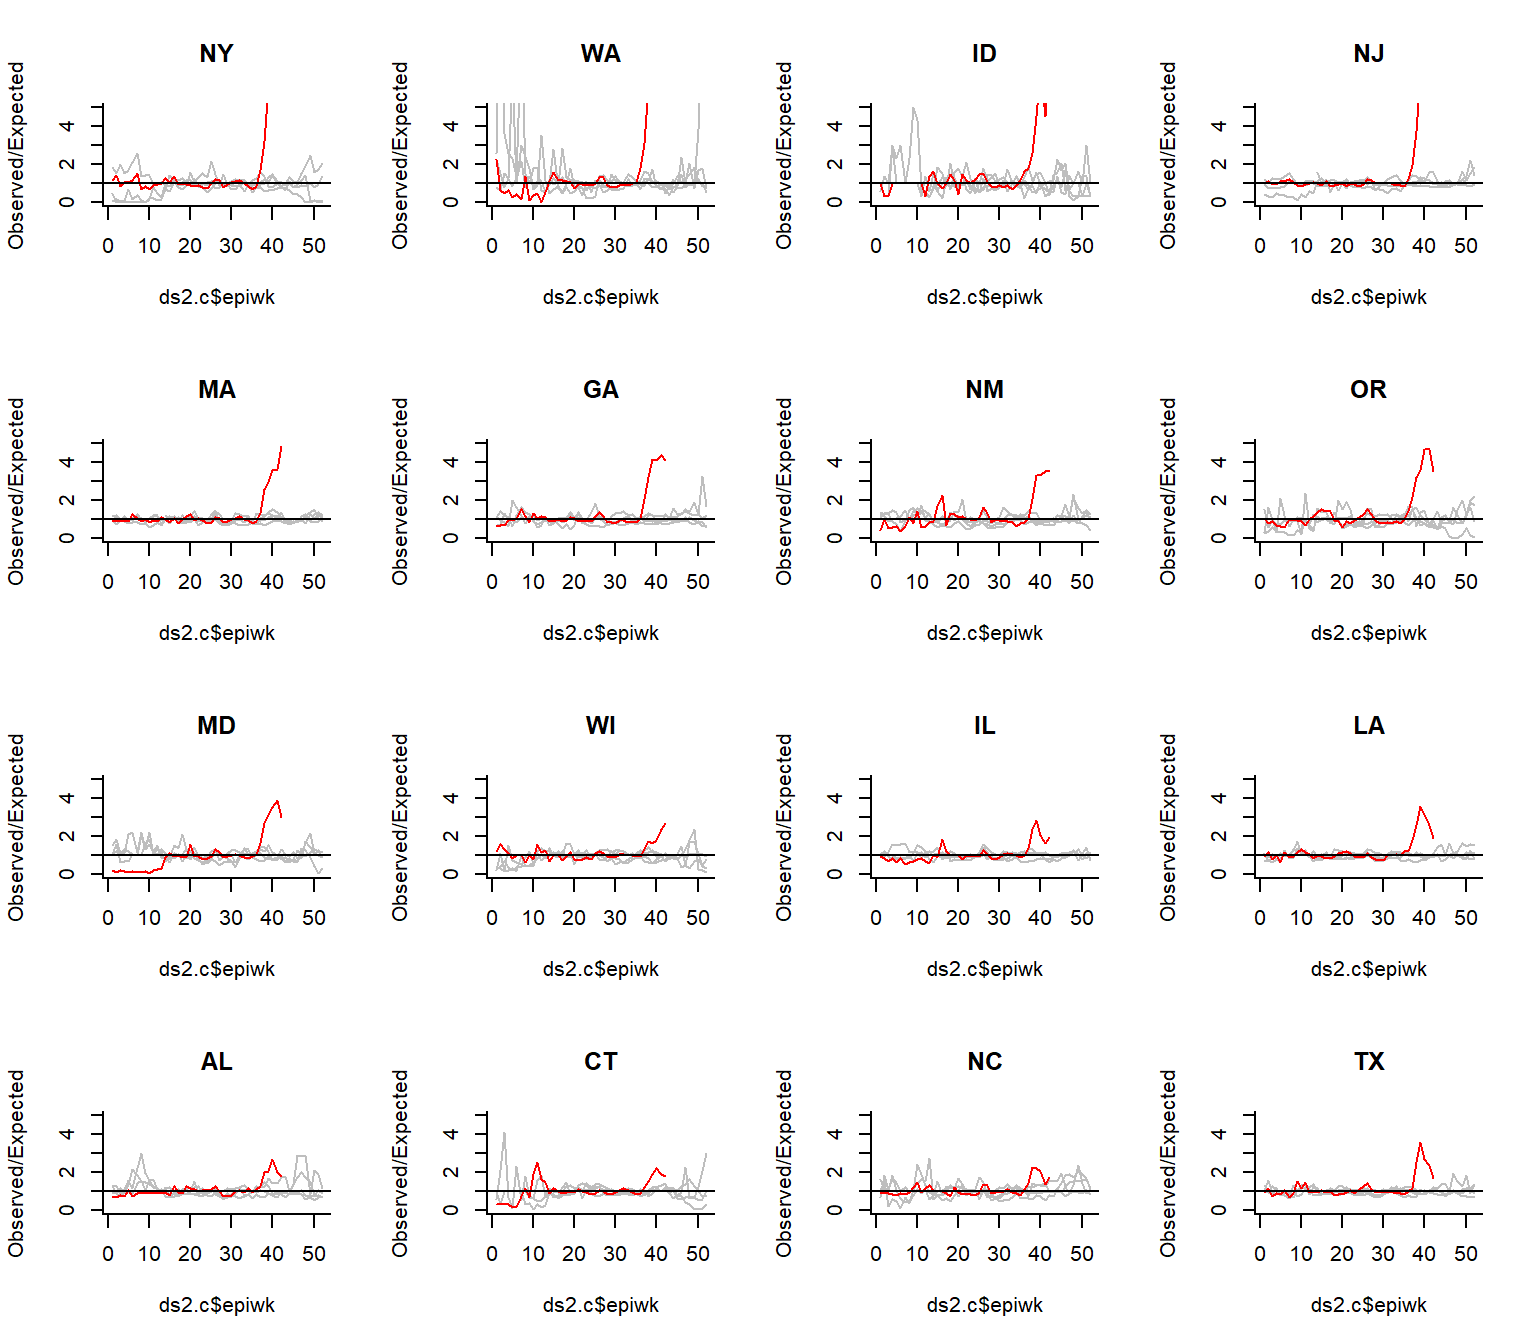
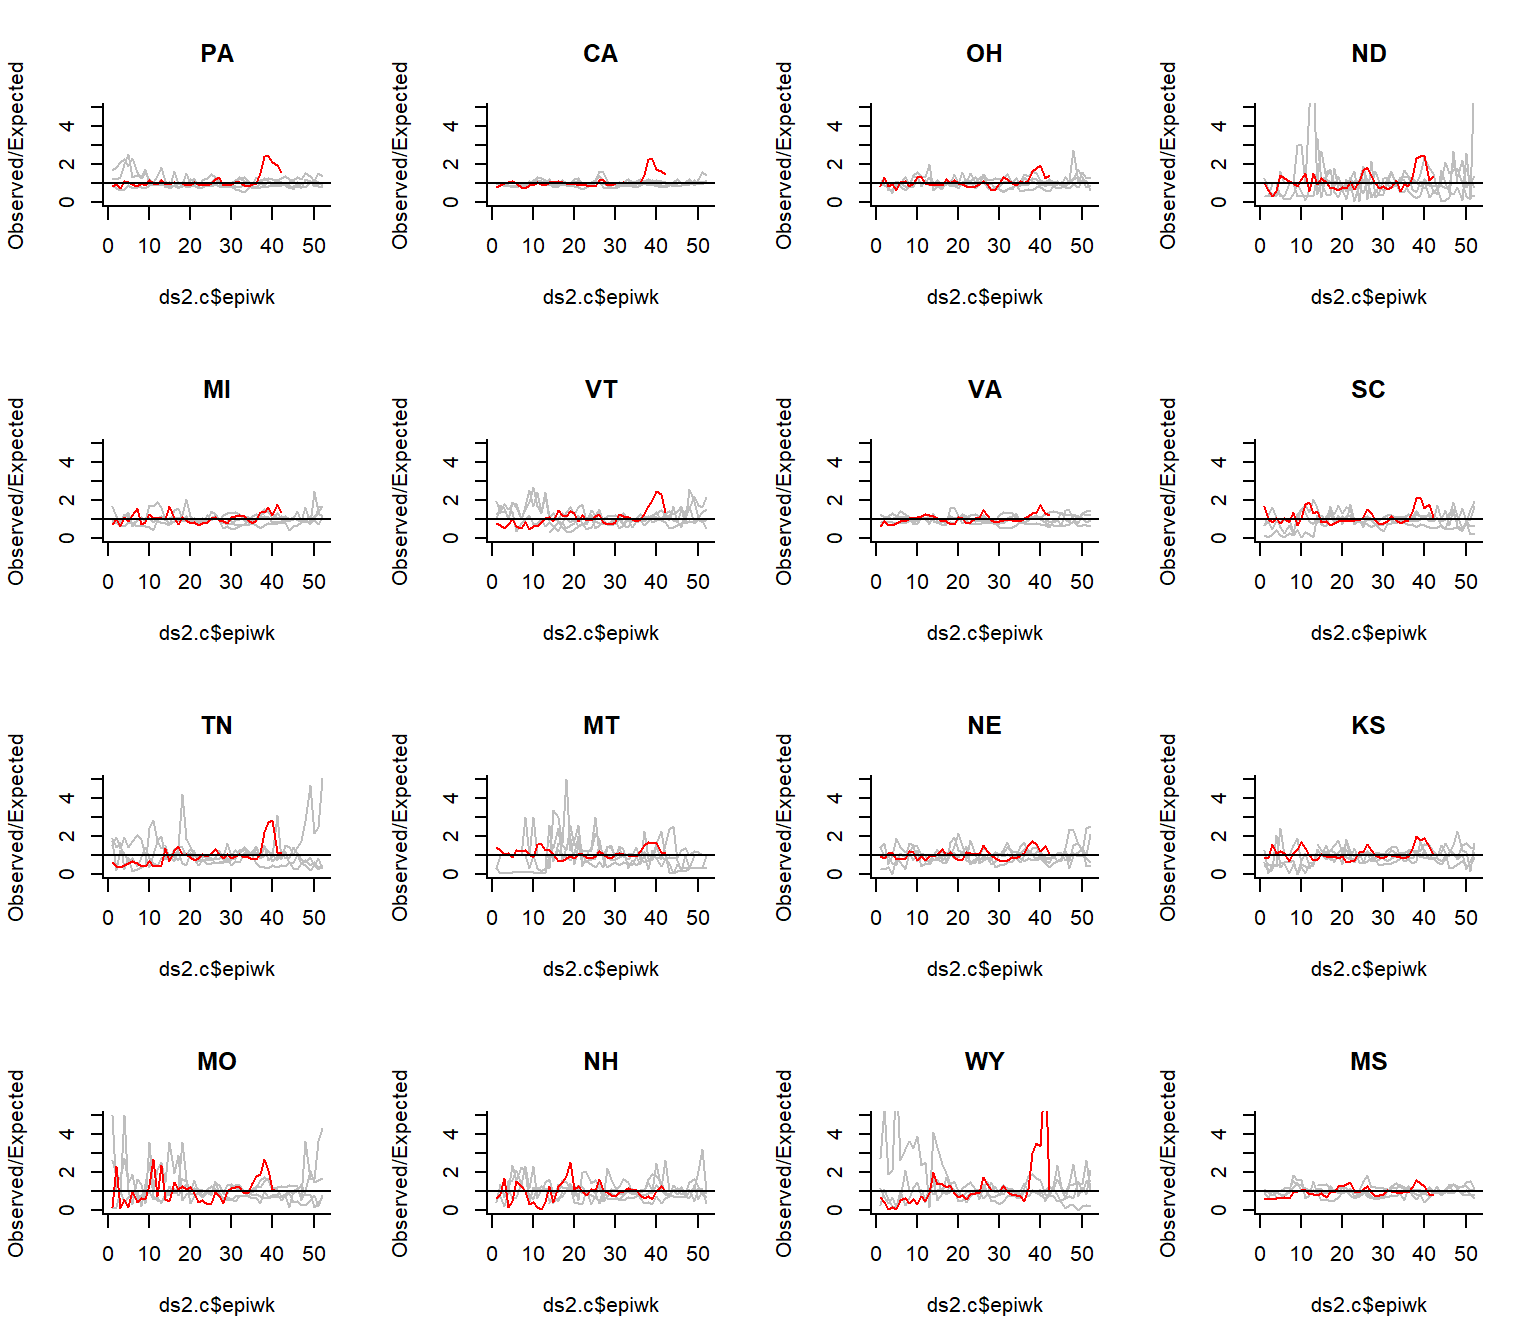
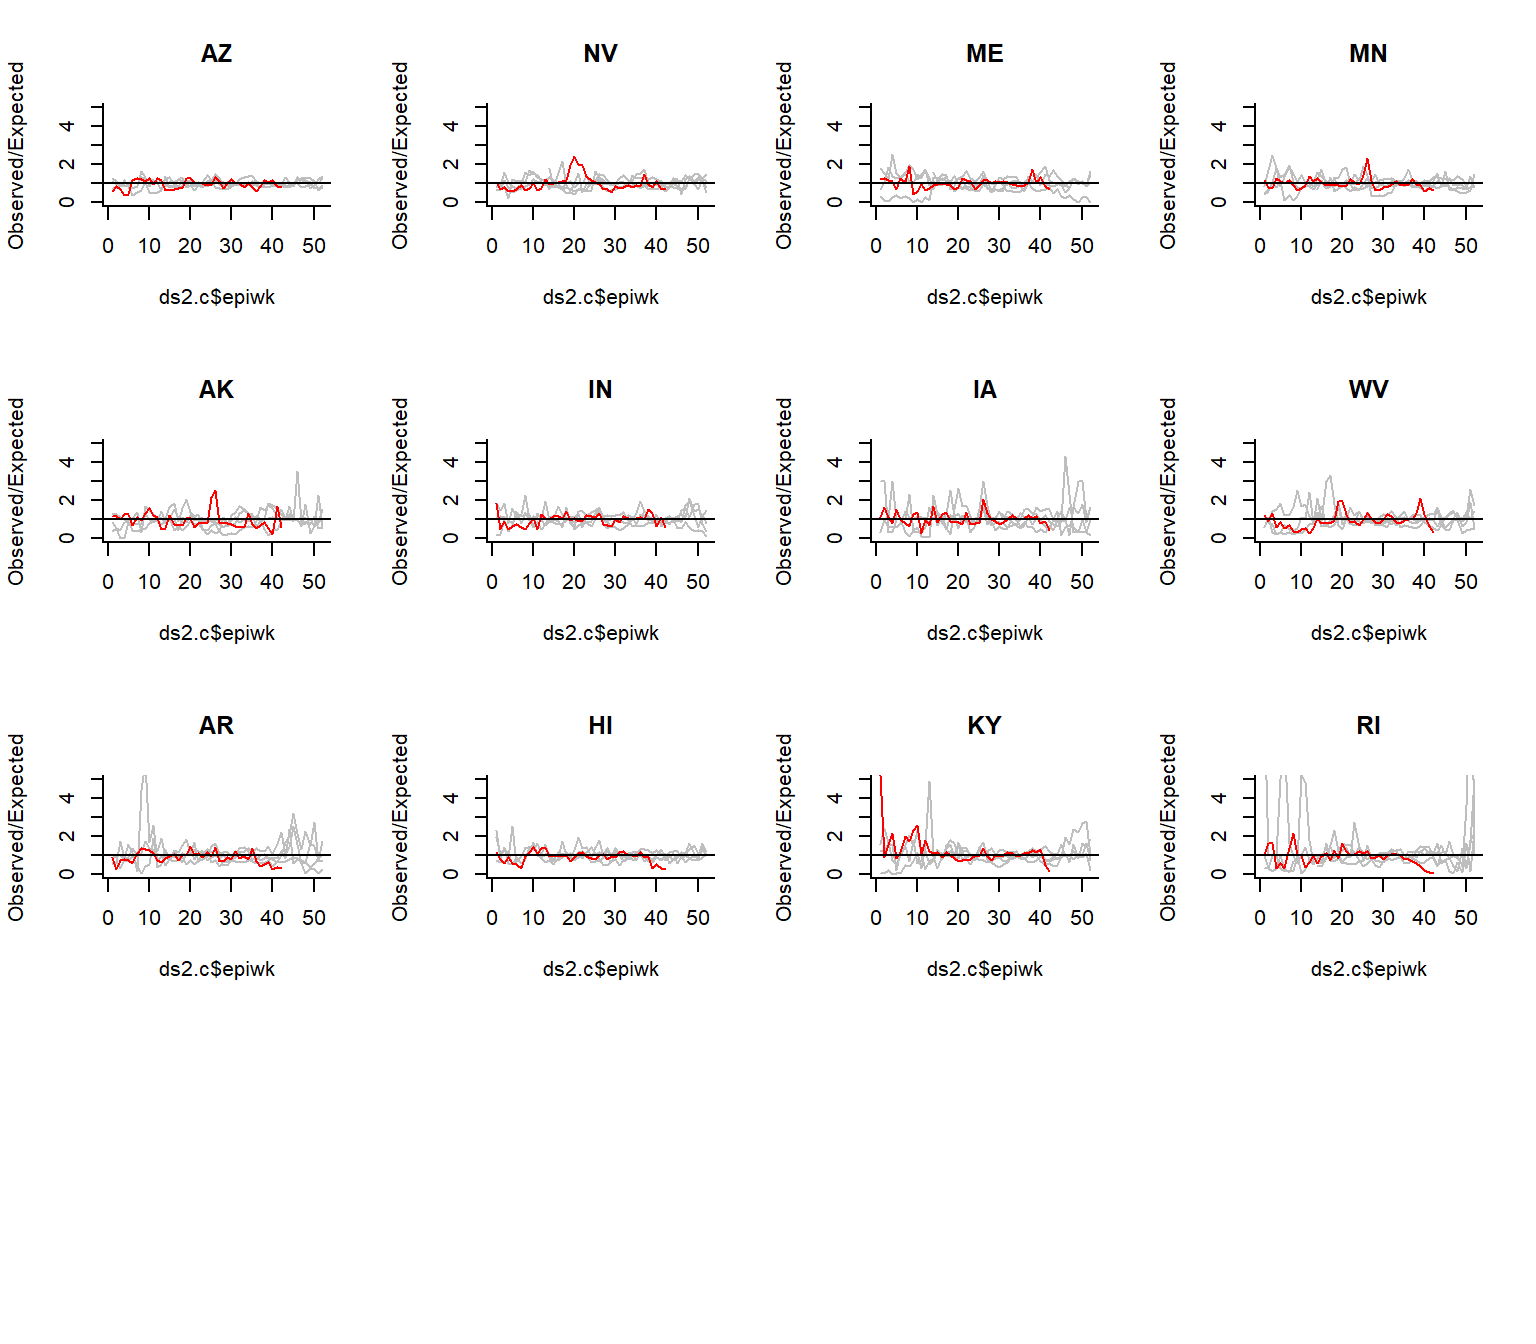
The goal for this package is to facilitate the formatting of line list data from syndromic surveillance datasets into time series and then the analysis of these data to detect increases above the seasonal baseline. For US data, there is an option to automatically adjust the data for state-specific flu activity (using data from NREVSS and/or state-specific RSV activity (based on Google search volume). The user can either start with line list data or formatted time series data
In this example, we will analyze ILINet data with a simple seasonal baseline, adjusting for flu and year-to-year variations. The model is fit through end-of-February 2020 and then extrapolated forward based on the time of year and the amount of influenza activity. Influenza activity is captured by using the proportion of tests that were positive from the NREVSS system (log transformed in model)